
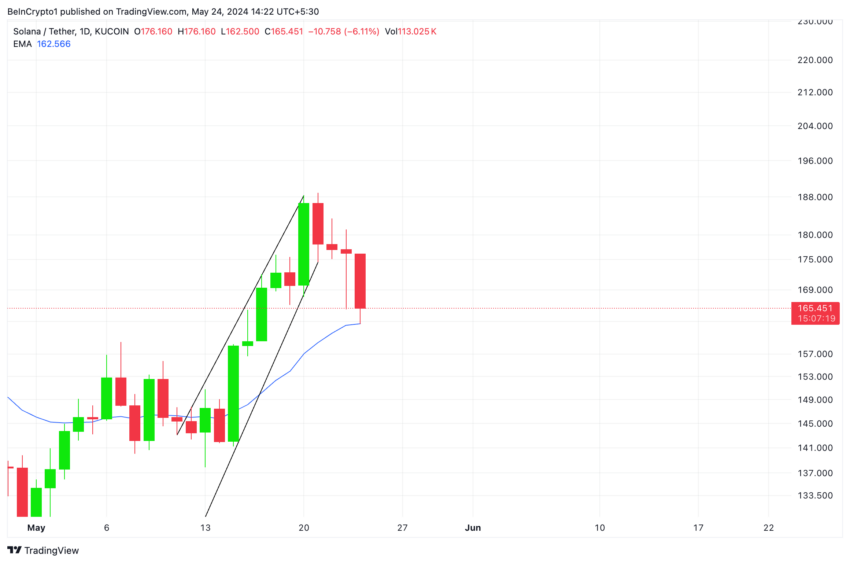
As the altcoin's price aims to cross below its 20-day Exponential Moving Average (EMA), SOL is put at risk of further decline as selling pressure continues to increase.
The double-digit decline in SOL's price in the past three days has pushed it toward its 20-day EMA. Poised to cross below the key average, this would signal a surge in SOL sell-offs among market participants.
An asset's 20-day EMA is a short-term moving average that reacts quickly to price changes. It reflects the average closing price of an asset over the past 20 days.
When an asset falls below this moving average, it is a bearish signal because it means that the asset's current price is less than its average price of the past 20 days. It is regarded as a shift toward coin distribution.
The decline in SOL's Money Flow Index (MFI) confirmed the surge in bearish influence. This indicator measures the buying and selling pressure behind SOL's price movement.
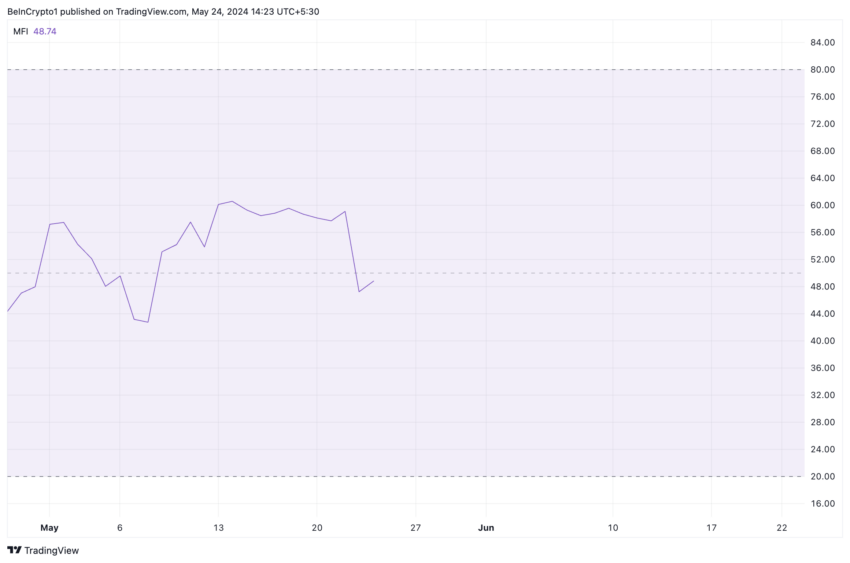
At press time, SOL's MFI rested under its 50-neutral line at 48.84, suggesting that selling activity outpaced buying momentum among market participants.
SOL Price Prediction: Long Traders Remain Steadfast
The decline in SOL's price in the past few days has led to a surge in long liquidations in the altcoin's derivatives market. Between May 20 and 23, over-leveraged SOL traders lost $19 million.
Liquidations happen when a trader's position is forcefully closed due to insufficient funds to maintain it.
Long liquidations occur when the value of an asset suddenly drops, forcing traders who have open positions in favor of a price rally to exit their positions.
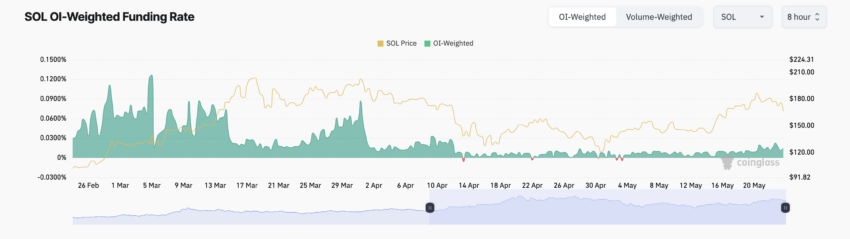
Interestingly, despite this, SOL futures traders continue to demand more long positions. Its funding rates have remained positive, at 0.014% at press time.
If this trend is maintained and the bulls regain control of the coin's spot market, SOL's price might rally to $169.94.
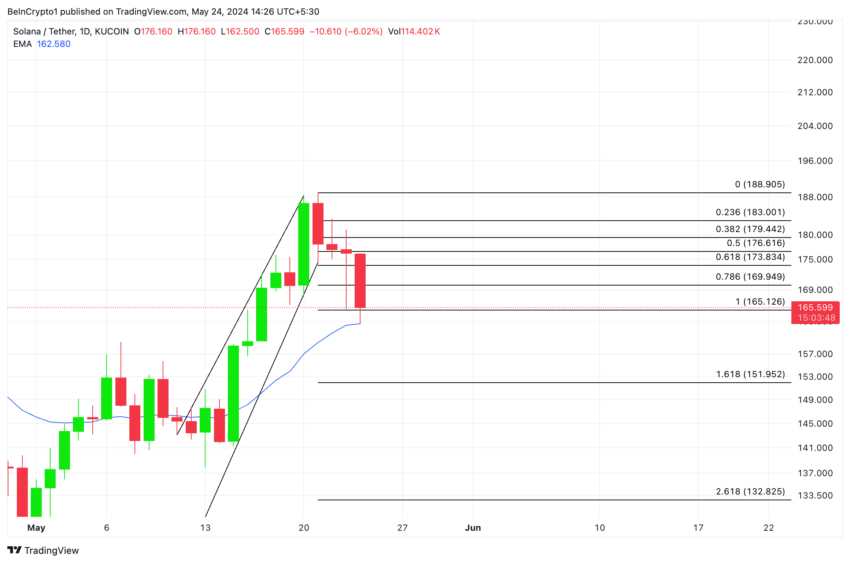
However, if selling pressure continued to mount, SOL's next price level might be $151.95.
Disclaimer
In line with the Trust Project guidelines, this price analysis article is for informational purposes only and should not be considered financial or investment advice. BeInCrypto is committed to accurate, unbiased reporting, but market conditions are subject to change without notice. Always conduct your own research and consult with a professional before making any financial decisions. Please note that our Terms and Conditions, Privacy Policy, and Disclaimers have been updated.