
With LINK's price already showing signs of resilience, this trend might set the stage for further upward momentum, making it a key cryptocurrency to watch in the coming days.
Chainlink Tokens See Massive Exodus
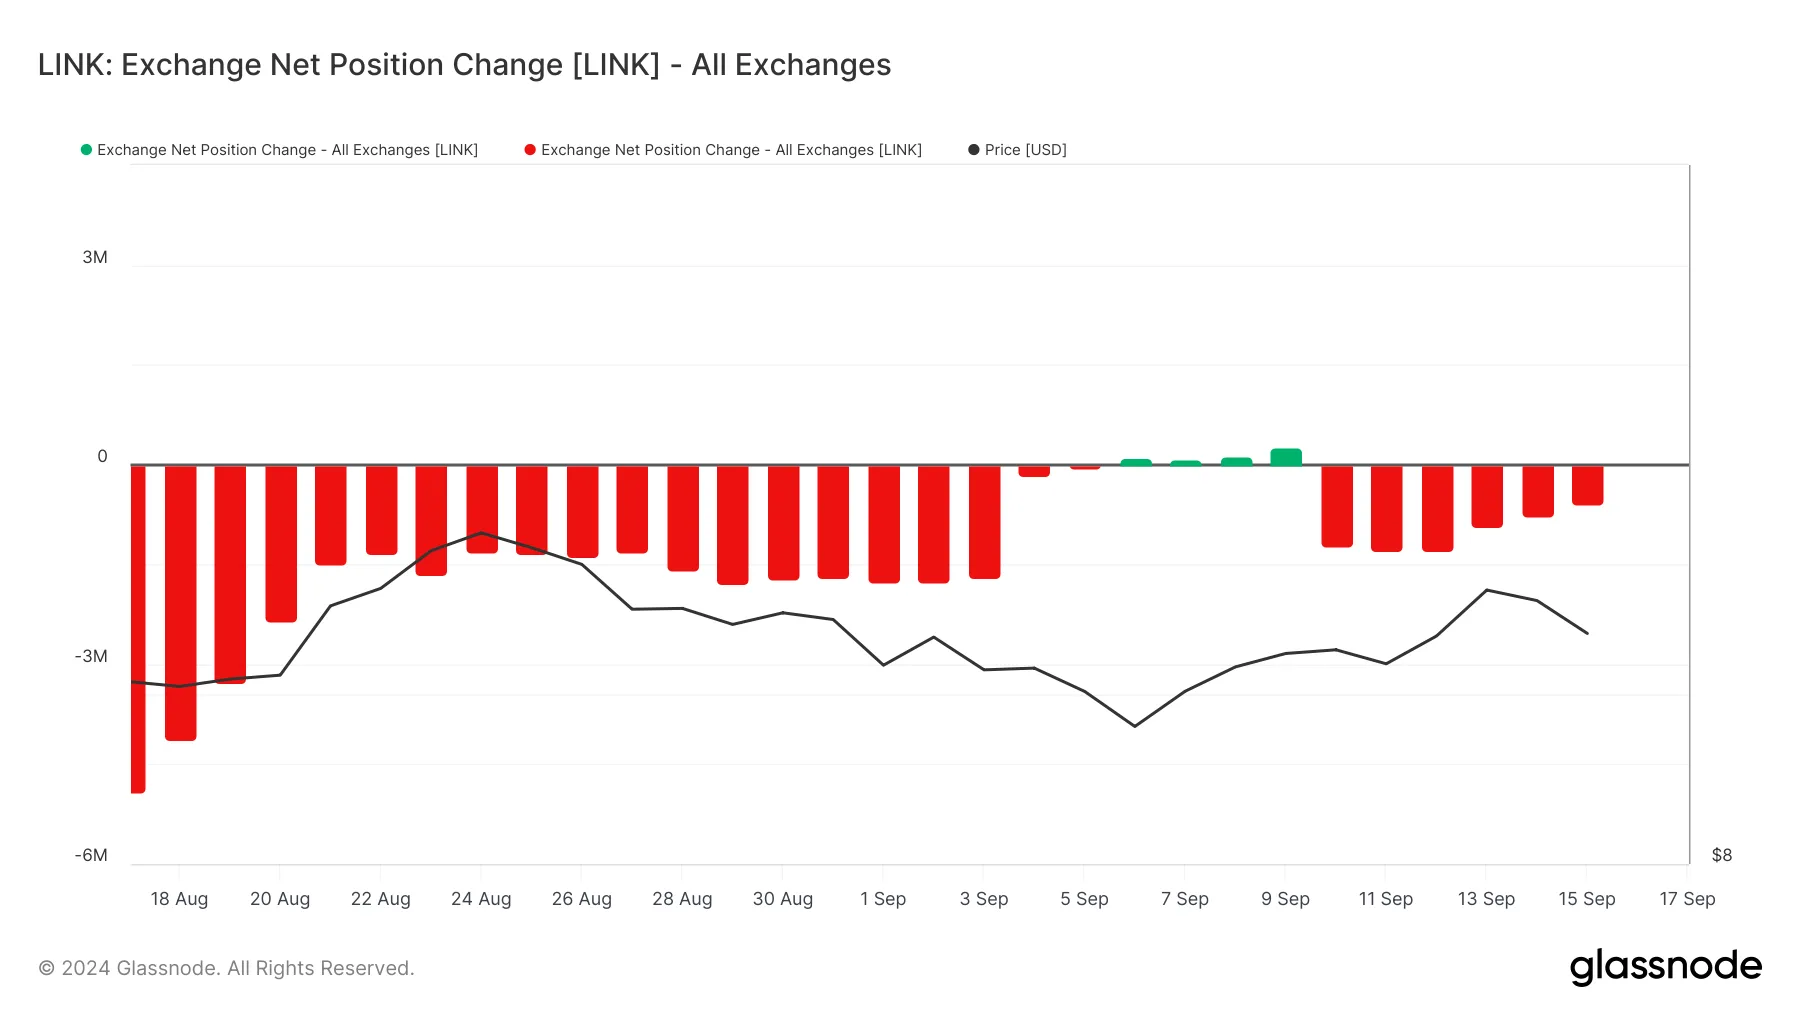
According to Glassnode, Chainlink saw a brief surge in tokens sent to exchanges between September 5 and 9, coinciding with a price drop from nearly $11 to $9.20.
However, since September 10, over six million tokens worth more than $60 million have been withdrawn from exchanges. This kind of movement typically indicates bullish sentiment, as reduced selling pressure on exchanges can support price appreciation.
At press time, Chainlink is trading at $10.60. If the trend continues, the cryptocurrency could retest the $12 level and potentially break above it.
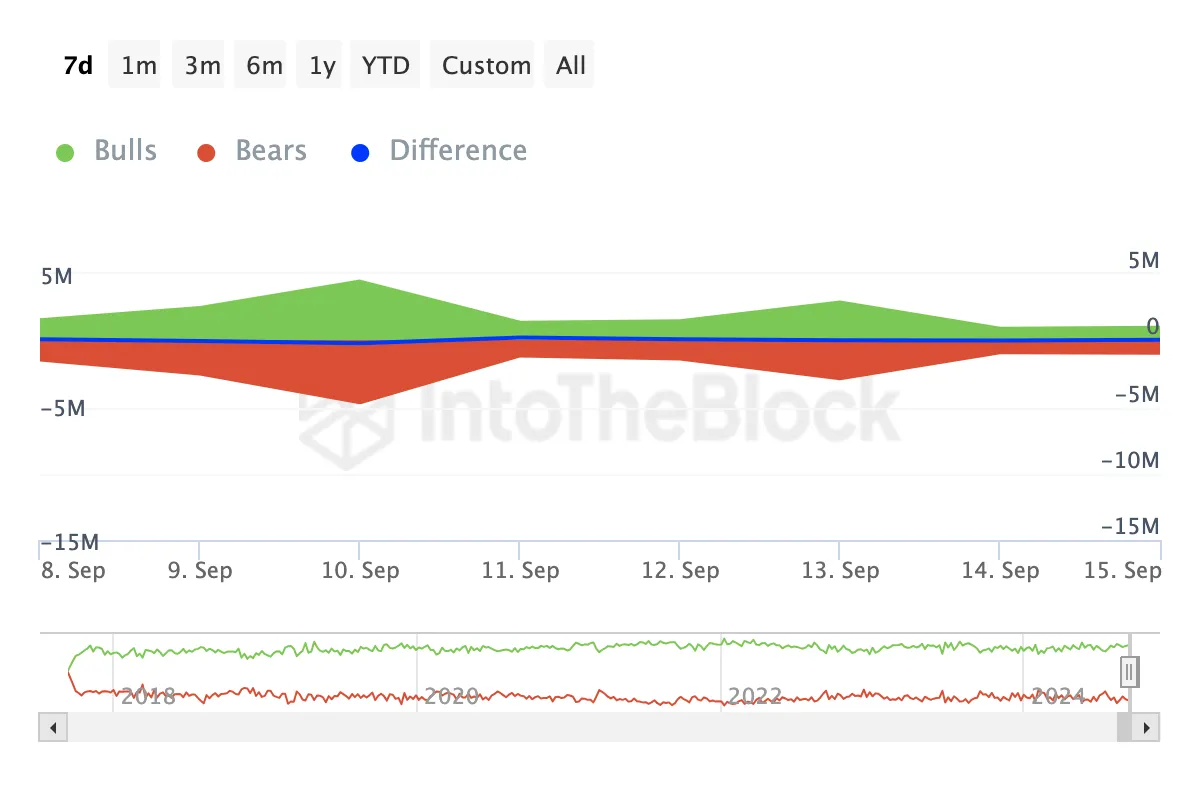
Furthermore, the Bulls and Bears indicator reinforces the bullish outlook. This metric tracks the number of addresses that bought or sold at least 1% of the total trading volume in a given day.
Crypto bulls are addresses that purchased at least 1% of the volume, while bears sold a similar amount. According to IntoTheBlock's data, Chainlink bulls have bought more volume than the bears have sold.
With this higher level of accumulation, it's less likely that Chainlink will drop to single-digit values again, as it did recently.
LINK Price Prediction: Boost on the Horizon
On the daily chart, the Parabolic Stop-and-Reverse (SAR) indicator flashed a bullish signal. The SAR determines an asset's price direction and also indicates the period during which a trend is changing.
Typically, when the dotted lines of the indicator are above the price, the trend is bearish. For instance, that happened around August 25 when the price was $12.34. By September 6, LINK's price decreased to $9.56.
Currently, the Parabolic SAR is below Chainlink's price. As a result, the token might see a 26% price increase to $13.38.
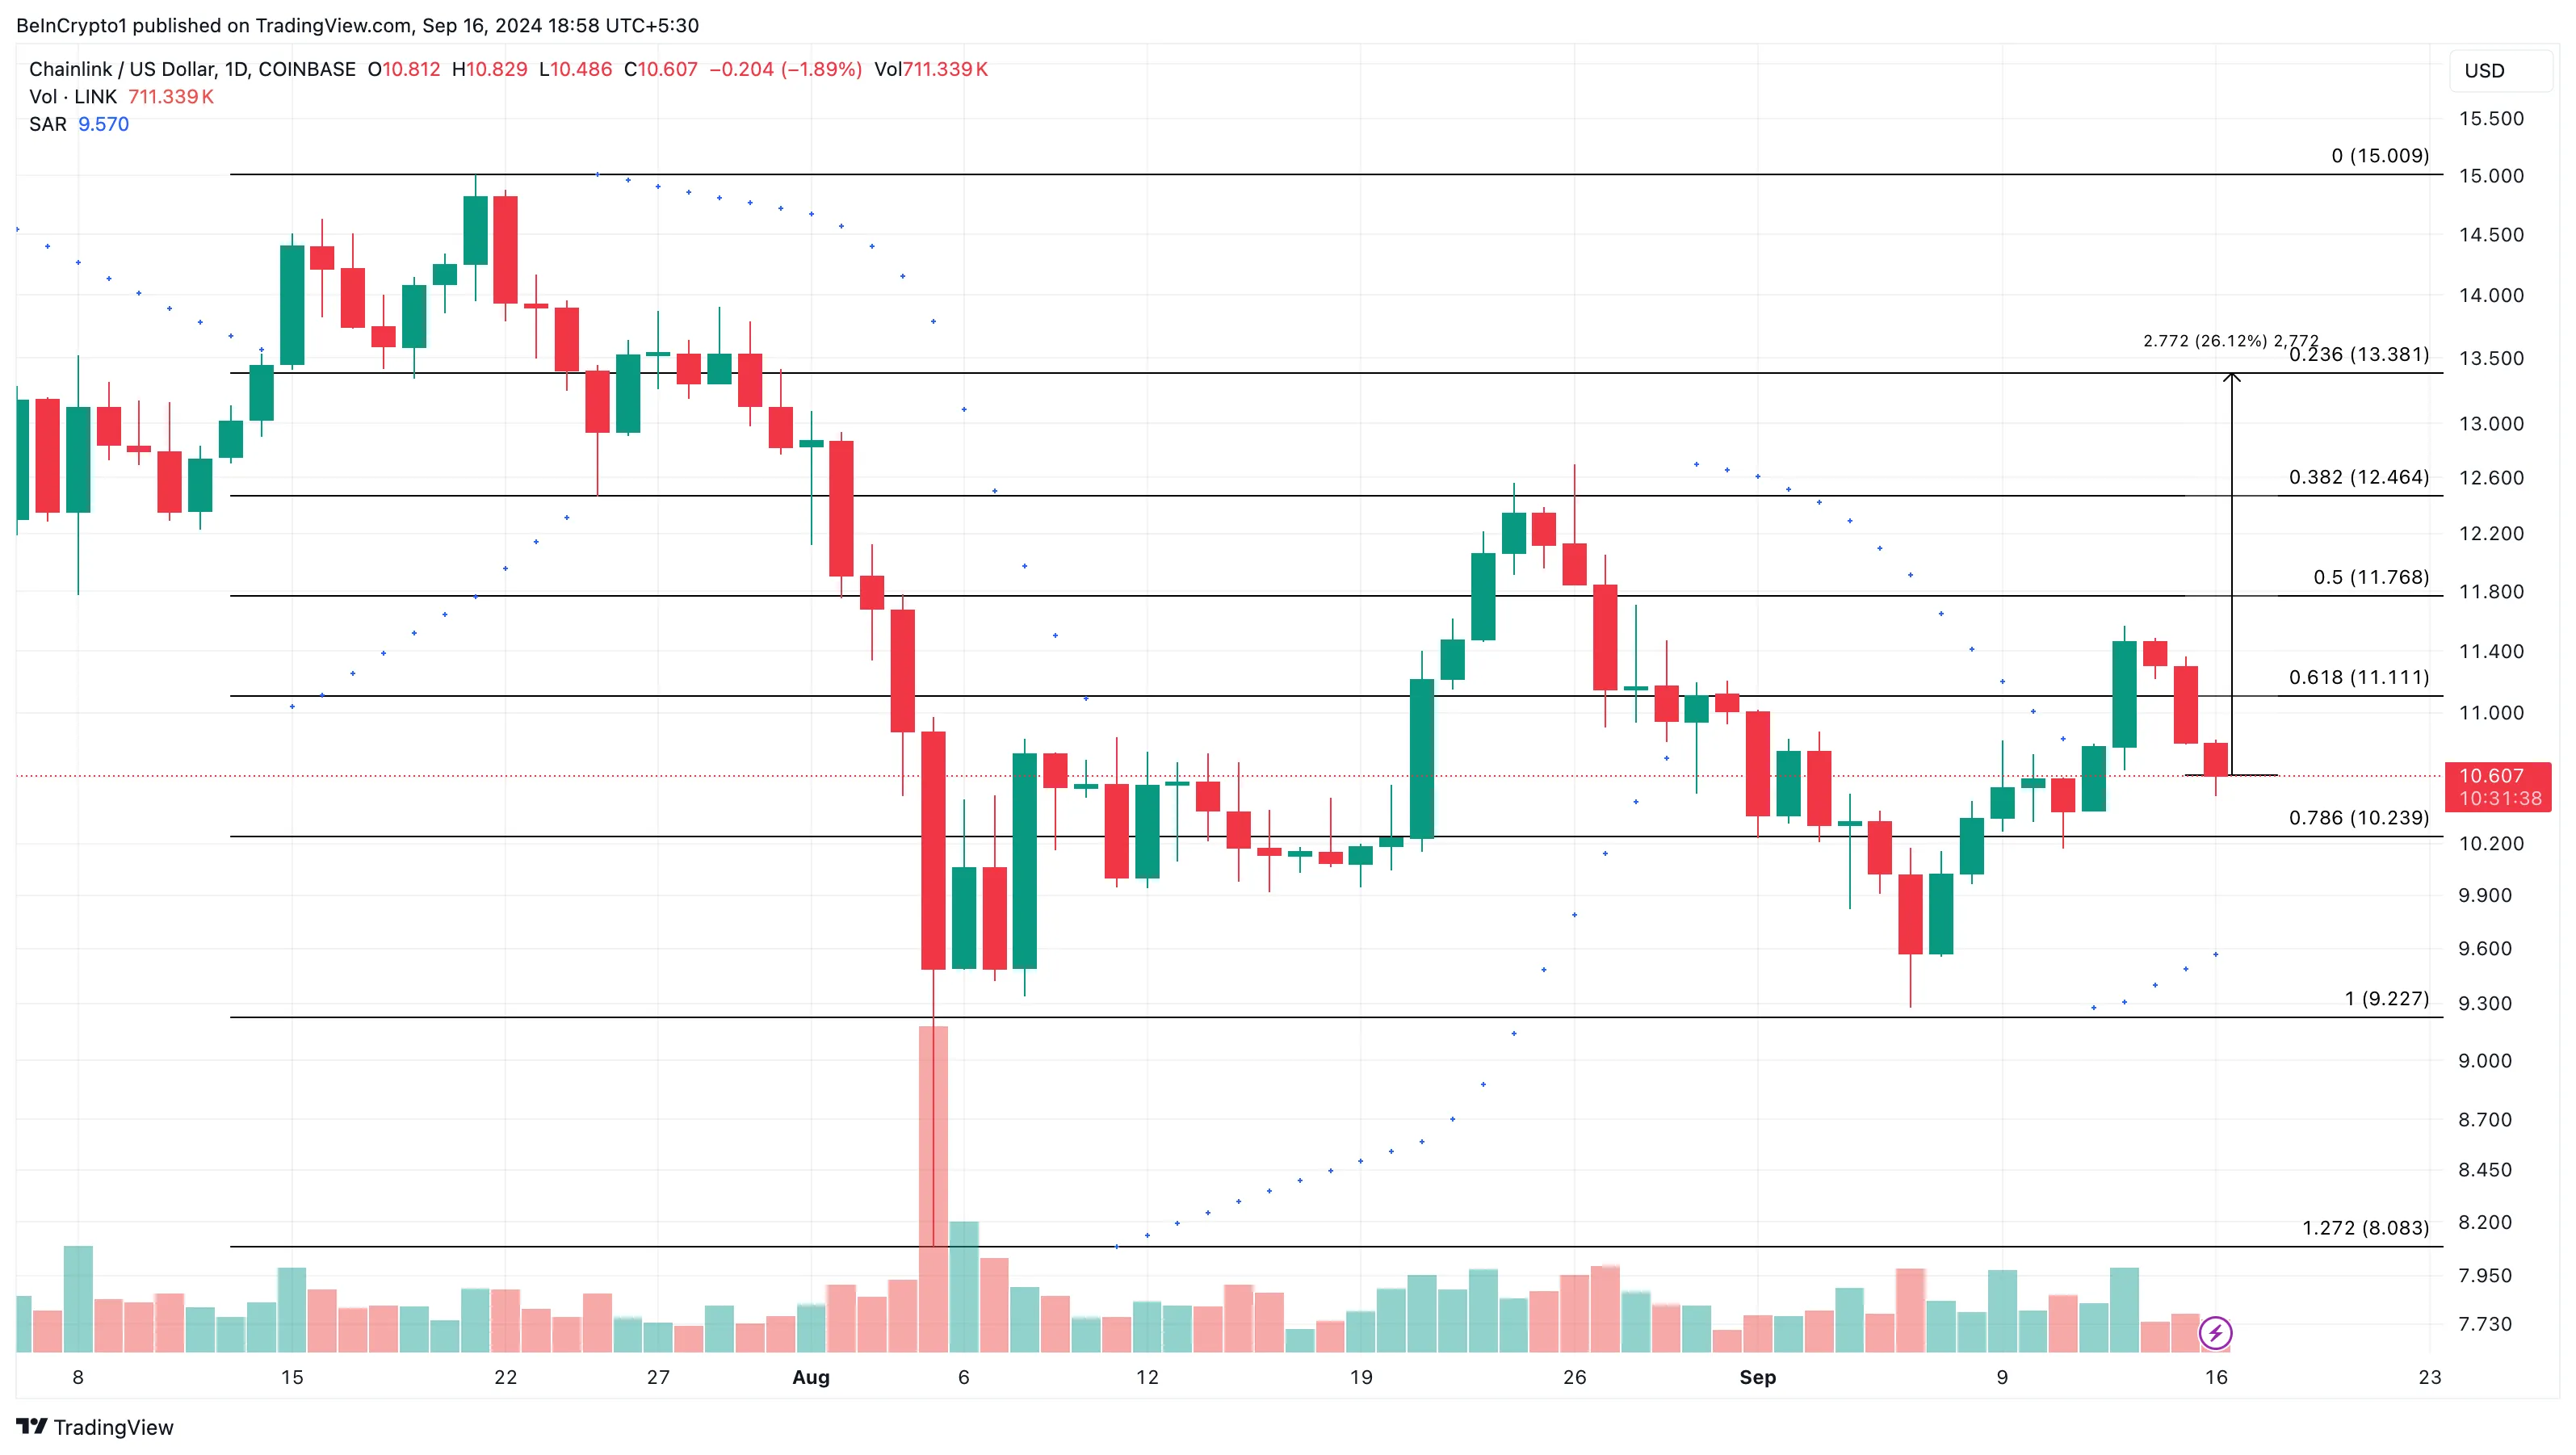
However, if LINK fails to break the resistance at $11.11, its price could decline to $9.22. Traders should keep a close eye on this key level, as it could determine whether the cryptocurrency experiences a potential upswing or a further drop.
.aff-primary {
display: none;
}
.aff-secondary {
display: block;
}
.aff-ternary {
display: none;
}
Disclaimer
In line with the Trust Project guidelines, this price analysis article is for informational purposes only and should not be considered financial or investment advice. BeInCrypto is committed to accurate, unbiased reporting, but market conditions are subject to change without notice. Always conduct your own research and consult with a professional before making any financial decisions. Please note that our Terms and Conditions, Privacy Policy, and Disclaimers have been updated.